Tech Support
 Documentation
 Login
 Contact Us


Go straight to an AI summary of this blog post instead 


Key Takeaways
- Linux monitoring is essential for ensuring performance, security, availability, and compliance across workloads.
- Use tools like htop, Netdata, and Prometheus to track CPU, memory, disk I/O, network activity, and overall system health.
- Monitoring is only half the equation — pair it with rebootless patching solutions like KernelCare to reduce downtime and close security gaps.
Monitoring Linux servers comes with a unique set of challenges, which you may not encounter with other operating systems. It requires a deeper level of tech proficiency. Administrators will find themselves configuring and scripting their systems to achieve optimal specifications.
The process can seem intimidating at first. While it has a learning curve, you can overcome most roadblocks by mastering the foundational concepts and leveraging common automation techniques. You’ll go a long way by just repeating and mastering the basics.
However, keeping servers in tip-top shape 24/7 demands more than just basic monitoring; it requires comprehensive strategies for continuous security, proactive maintenance, and seamless updates. This guide will explore these essential aspects.
Why Linux Monitoring Matters
Monitoring your Linux systems is essential for maintaining stability, performance, and Linux security — especially in modern, always-on environments.
Here’s why Linux monitoring is critical in 2026:

- Performance: Detect high CPU, memory, disk, or network usage before it affects users.
- Security: Identify unusual processes, failed logins, or suspicious behavior early.
- Compliance: Maintain audit trails and meet regulatory or industry-specific requirements.
- Availability: Prevent outages and reduce Mean Time to Recovery (MTTR).
- Efficiency: Optimize resources, avoid over-provisioning, and streamline operations.
The Real Challenges of Monitoring Linux Systems
The Linux operating system gives you incredible control and flexibility, but keeping an eye on modern systems isn’t as simple as running a few commands. Mastering this dynamic landscape, where issues can hide in plain sight, is key for effective monitoring.
Tool Sprawl & Integration
The Linux ecosystem is packed with monitoring tools — everything from lightweight command-line utilities to full-scale enterprise platforms. But more options don’t always mean better visibility.
The challenge lies in selecting the right combination of monitoring solutions, integrating disparate data sources, and building a unified view without creating tool sprawl or data silos that complicate analysis and alerting.
Dynamic & Distributed Environments
Modern Linux deployments often involve vast, distributed infrastructures with ephemeral components like containers and microservices. Monitoring these highly dynamic, short-lived instances and ephemeral workloads poses a significant challenge, requiring advanced strategies to track performance, allocate resources, and ensure visibility across constantly shifting IT infrastructure.
Alert Fatigue & Noise
With the sheer volume of metrics available, a common pitfall is generating too many alerts or false positives. This leads to alert fatigue, where critical warnings get lost in the noise.
Sysadmins face the challenge of fine-tuning thresholds and building intelligent alerting systems that provide timely, relevant notifications without overwhelming teams.
Root Cause Analysis
A sudden CPU spike could mean a dozen different things — a runaway process, a database lock, or even a hidden network bottleneck. In complex Linux stacks, symptoms rarely point directly to the problem. The challenge lies in piecing together clues from logs, metrics, and traces to find the actual issue. Without the right monitoring tools, you are stuck playing detective instead of fixing things.
Security Visibility & Threats
Monitoring for security is not just about detecting known threats; it’s about identifying anomalous behavior, unauthorized access, and suspicious processes.
The challenge lies in sifting through vast logs and system data to spot subtle indicators of compromise, maintain audit trails, and ensure continuous compliance in an evolving threat landscape.
Maintenance Overhead & Downtime
Monitoring can identify Linux vulnerabilities — but patching them safely is another challenge. Reboots during kernel updates still cause downtime. Without rebootless patching, maintenance becomes a recurring operational risk. Ensuring high availability during these necessary procedures, and minimizing the risk of reboots and downtime, is a constant balancing act for administrators.
Key Metrics to Track on Linux Servers
Effective Linux monitoring also hinges on tracking the right indicators. Below are the most important metrics across CPU, memory, disk, network, and system health, crucial for early issue detection and maintaining uptime.
1. CPU Utilization
- Tracks how much processing power is being used.
- Monitor user vs. system CPU, idle time, and iowait.
- Useful tools: top, htop, mpstat.
- High iowait often signals underlying disk I/O bottlenecks, not just CPU overload.
2. Memory Utilization
- Measures RAM usage, free memory, and swap usage.
- Monitor page faults and buffer/cache consumption.
- Tools: free, vmstat, sar, smem.
- Excessive swap usage is a strong indicator of memory pressure, leading to significant performance degradation.
3. Disk I/O
- Tracks read/write speed, IOPS, and I/O wait time
- Use iostat, iotop, or dstat for disk monitoring
- High I/O latency often impacts app performance first
4. Network Throughput & Errors
- Network monitoring of RX/TX rates, dropped packets, and connection states.
- Tools: ifstat, ss, netstat, nload, vnstat.
- Essential for detecting bandwidth saturation, packet loss, network bottlenecks, or potential DDoS attacks.
5. Load Average
- Indicates the average number of processes waiting for CPU time.
- Monitor 1, 5, and 15-minute averages.
- Tools: uptime, top.
- A sustained load higher than the number of CPU cores often signifies system overload.
6. Uptime and Availability
- Track system boot time, uptime duration, and unexpected restarts.
- Tools: uptime, who -b, last reboot.
- Critical for meeting SLAs, tracking system reliability, and planning scheduled maintenance for business continuity.
7. Filesystem Usage
- Monitor disk space, inode usage, and mount point capacity.
- Tools: df -h, du -sh, ncdu.
- Full disks can lead to failed writes, application crashes, and disrupted logging.
8. Process and Service Health
- Check if critical processes are running and consuming expected resources.
- Tools: ps, pidstat, systemctl status.
- Critical to alert on service failures, unexpected stops, or zombie processes.
Best Tools for Linux Monitoring
Below are some of the top Linux monitoring tools to consider, covering both command-line utilities and enterprise-grade platforms. Each tool has different pros and cons, which will determine how suitable it is for your team’s unique monitoring needs.
htop
An enhanced, interactive command-line utility, htop provides a real-time view of CPU, memory, swap, process trees, and load averages.

Pros:
- Color-coded, keyboard-friendly interface for easy navigation.
- Great for quick, interactive resource checks and process control.
- Lightweight and widely available on most Linux distributions.
Cons:
- Lacks historical data tracking.
- Primarily for single-server, real-time insights.
btop
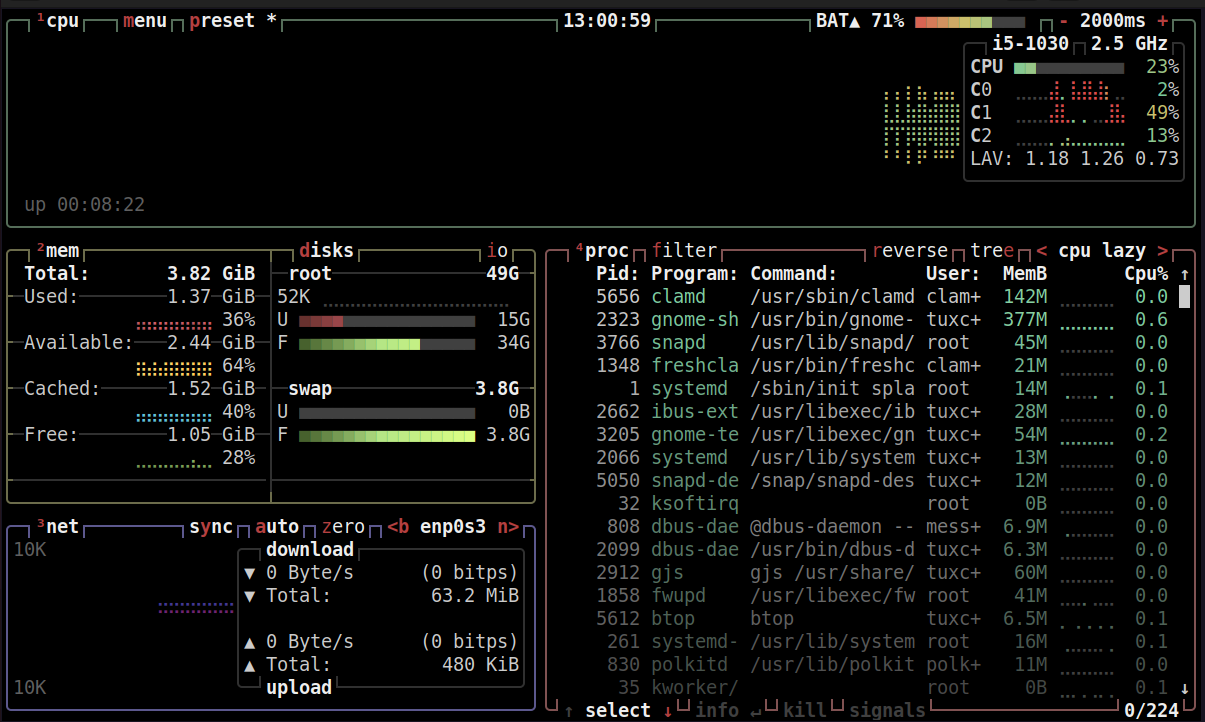
A visually stunning and feature-rich system monitor, btop (and its predecessors like bashtop/bpytop) offers real-time insights into CPU, RAM, disk, and network activity through an appealing terminal interface.
Pros:
- Modern, highly responsive UI with mouse support and extensive customization.
- Provides more detailed metrics and better visualization than htop in a terminal.
- Excellent for interactive local or SSH-based monitoring.
Cons:
- Its visual richness might consume slightly more resources than simpler CLI tools.
- Less ideal for pure scripting or very low-resource remote agents where only raw text output is needed.
iotop
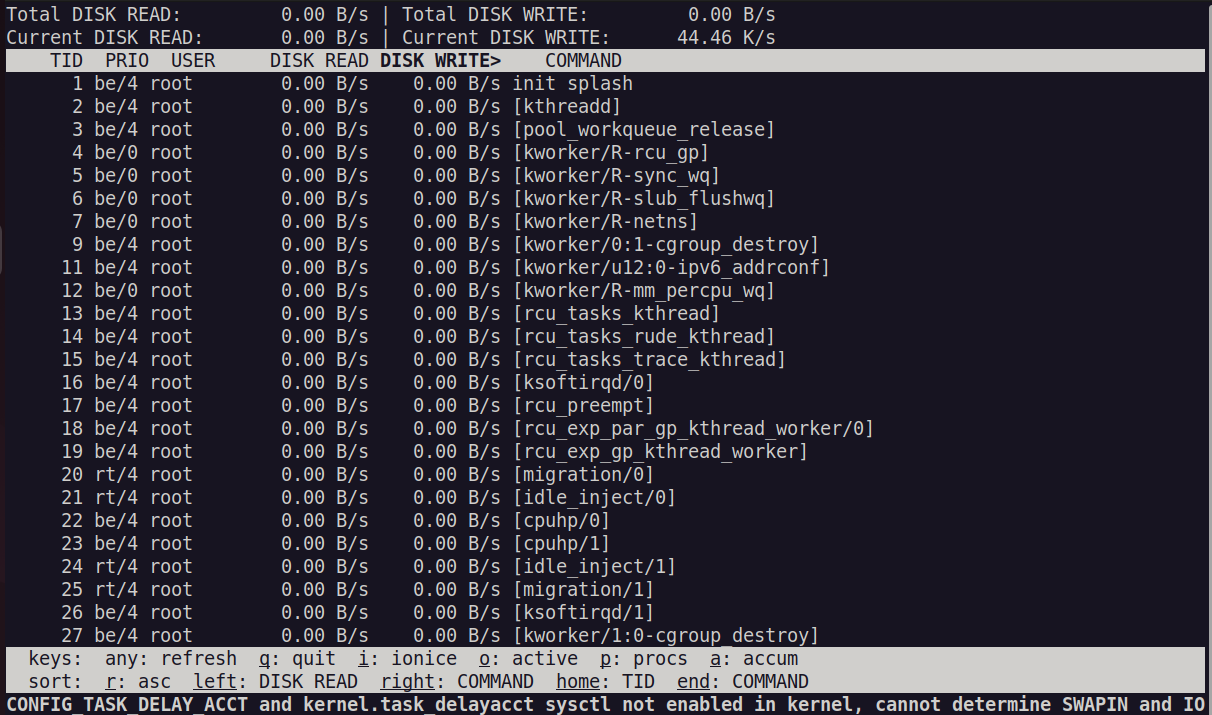
iotop is a command-line utility specifically designed to track disk I/O usage by process. It’s invaluable for real-time identification of which processes are causing disk bottlenecks, making it a go-to tool during performance slowdowns.
Pros:
- Provides real-time, per-process disk I/O statistics.
- Excellent for pinpointing specific applications or processes causing disk bottlenecks.
- Simple and direct for immediate troubleshooting.
Cons:
- Typically requires root privileges to run.
- Focuses solely on disk I/O, not a comprehensive system monitor.
Netdata
Netdata is a real-time, high-fidelity monitoring agent that provides instant insights into hundreds of system metrics via interactive web dashboards and health alerts.

Pros:
- Extremely lightweight, auto-configuring, and virtually zero-maintenance.
- Offers deep, per-second granularity for immediate troubleshooting.
- Interactive web UI is accessible from any browser.
- Distributed architecture allows for scalable enterprise deployments.
Cons:
- Requires a web browser for its dashboards, less ideal for pure CLI environments.
- May require more thought for long-term data retention compared to dedicated time-series databases.
Prometheus + Grafana
This powerful combination leverages Prometheus to scrape and store time-series metrics, while Grafana provides robust visualization through customizable dashboards and integrated alerting.

Pros:
- Highly scalable, flexible, and alert-driven for complex environments.
- Ideal for cloud-native, microservices, and hybrid Linux infrastructures.
- Vast ecosystem of exporters for various services and applications.
- Open-source with strong community support.
Cons:
- Requires initial setup and configuration of both Prometheus and Grafana.
- Needs dedicated “exporters” (like node_exporter) installed on target systems.
- Can have a steeper learning curve for beginners due to its distributed nature.
Zabbix
Zabbix is a comprehensive enterprise monitoring solution capable of overseeing Linux servers, applications, network devices, and virtual machines.

Pros:
- Strong in historical tracking, advanced alerting, and flexible dashboards.
- Provides built-in agents and SNMP support for broad compatibility.
- Centralized management console for large-scale environments.
- Extensive templating system for consistent monitoring across many hosts.
Cons:
- Has a steeper learning curve compared to simpler tools, especially for initial setup and complex configurations.
- Resource requirements for the Zabbix server can be higher for very large deployments.
Monitoring Best Practices & Techniques for Linux System Administrators
Effective Linux system monitoring goes beyond simply reacting to alerts; it requires a proactive and strategic approach. By adopting these key techniques, administrators can gain deeper insights, prevent issues, and ensure optimal system health.
Embrace Automation for Routine Tasks
Manual monitoring and maintenance tasks, especially for large infrastructures, are prone to human error and consume valuable time.
Automate repetitive processes like log analysis, performance data collection, and even basic threat detection tasks, such as identifying suspicious log entries. This frees up administrators to focus on complex problem-solving and strategic initiatives rather than rote work.
Implement Infrastructure as Code (IaC) for Monitoring Configurations
Managing monitoring configurations across numerous servers can quickly lead to inconsistencies if done manually. By treating monitoring setups as code, IaC tools allow you to define, version control, and automatically deploy configurations. This ensures uniformity, reduces configuration drift, and minimizes human error in your monitoring landscape.
Track Microservices Communication with Observability
In modern microservices architectures, understanding the interactions between distributed services is paramount.
Adopt observability practices, including distributed tracing and service mesh monitoring, to track communication flows, dependencies, and latency between services. This provides crucial insights into potential bottlenecks, error rates, and performance issues within complex applications.
Fine-Tune Kernel Parameters Strategically
Achieving optimal Linux server performance often requires more than default settings. Fine-tuning kernel parameters allows for system-level optimizations specific to your workload, impacting memory management, network stack behavior, and I/O scheduling.
This is an iterative process — changes should be tested in staging environments and monitored closely before applying to production.
Proactively Analyze Abnormal Traffic Patterns
Consistent analysis of network traffic patterns is a critical security practice. By monitoring for deviations from normal behavior – such as unusual port activity, sudden spikes in outbound data, or access from unexpected geographies – administrators can detect and prevent unauthorized access or ongoing cyberattacks in real-time. Automated anomaly detection tools can significantly aid in this vigilance.
Linux Monitoring in Cloud and Virtual Environments
While fundamental Linux metrics remain critical, effective monitoring in cloud or virtualized environments introduces distinct complexities. Instances are often ephemeral, scaling dynamically, and part of highly distributed microservices architectures. This demands a more flexible strategy, as traditional agent-based tools often fall short in tracking instances that spin up and down rapidly.
Key considerations include leveraging cloud-native monitoring services (e.g., AWS CloudWatch, Azure Monitor), which offer auto-discovery and native integration with cloud resources. Understanding the cloud provider’s shared responsibility model is also vital — clearly defining which components (like hardware and core networking) they monitor, versus what remains your responsibility (such as Linux VMs, apps, and data).
The shift towards observability becomes paramount, emphasizing the collection and correlation of metrics, logs, and traces across distributed components. This detailed visibility is crucial for tracking dynamic resource allocation, optimizing cloud spend by identifying underutilized resources, and maintaining consistent visibility as infrastructure constantly shifts.
Elevate Your Linux Monitoring: Next Steps
Effective Linux system monitoring, whether on-premise, in virtual environments, or across dynamic cloud infrastructures, demands more than just basic tools or reactive responses. As we’ve explored, mastering this evolving landscape requires strategic approaches to metric analysis, automation, and addressing the unique challenges of modern Linux deployments, particularly around security and uptime. Linux automation tools can help by automating repetitive tasks, such as monitoring configuration, log analysis, and basic threat detection, allowing administrators to focus on complex issues. Given these demands, relying solely on manual processes can introduce risk and inefficiency.
This is where TuxCare’s KernelCare Enterprise becomes invaluable. With automated, rebootless patching, KernelCare eliminates patch-related downtime and ensures your Linux infrastructure remains secure, compliant, and stable without disruption.
Ready to simplify Linux patching and improve security? Talk to a TuxCare expert today and discover how KernelCare can help you automate patch management and protect your Linux servers.