Tech Support
 Documentation
 Login
 Contact Us



Go straight to an AI summary of this blog post instead 


Key Takeaways
- Speed metrics like MTTP, MTTR, and MTTD show how long real risk stays open.
- Coverage metrics expose the assets nobody is measuring yet.
- Read metrics in pairs, because a single number flatters and misleads.
- Five to eight metrics tied to real decisions beat thirty tied to none.
Your vulnerability scanning tool says there are 4,000 open vulnerabilities across the estate. Your manager asks one question. Are we getting better or worse? Most teams cannot answer that cleanly, and the gap between the data you collect and the decisions you can actually defend is exactly what vulnerability management metrics exist to close. The right handful of KPIs tells you how fast you patch, what you are missing, and where risk is quietly piling up.
This guide walks through which metrics are worth tracking, how to read them without fooling yourself, and how to turn them into action.
What Are Vulnerability Management Metrics?
Vulnerability management metrics are the numbers that measure how well your program finds, prioritizes, and fixes security weaknesses over time. Not the raw vulnerability count. Anyone can pull that from a scanner. These numbers measure your team’s behavior, which means how fast you detect, how fast you remediate, and how much of your actual environment you are even looking at.
The reason this matters more every year is volume. The CVE Program recorded just over 48,000 published CVE records in 2025, up from just over 40,000 in 2024. Independent analysis of published records counted more than 35,000 in the first half of 2026 alone, which puts the year on pace to set another record by a wide margin. No team patches everything. Metrics are how you decide what goes first and why that call was defensible.
Most programs track three families. Speed metrics cover how quickly you detect a vulnerability and move it through remediation, which is where MTTD, MTTR, and MTTP live. Coverage metrics cover how much of your attack surface you are actually scanning and how many fixes land inside their deadline. Risk posture metrics describe the shape of your open vulnerabilities by severity, exploitability, and age.
A note of caution. Total vulnerabilities found is the metric executives request most and engineers should trust least. It goes up when you improve scanning and down when you stop looking. On its own it measures activity, not safety.
How Tracking Vulnerability Metrics Drives Better Security Decisions
Metrics move a security program from doing its best to knowing exactly where it is slow. That shift from gut feel to evidence is the whole point.
Visibility comes first, because you cannot improve a number you do not track. Action follows, because a rising MTTP on internet-facing hosts tells you exactly where to focus. Outcomes come last, when you can show quarter over quarter that critical bugs now close in days instead of weeks.
Tracked consistently, metrics give a defensible answer to whether the program is improving, backed by trend lines rather than vibes. They rank work by actual risk rather than by whoever raised the loudest ticket. They surface early warnings when vulnerability patching is falling behind on a specific asset group. And they make budget conversations easier, because slow remediation has a dollar cost you can name.
If you are looking to outsource or strengthen your remediation capabilities, you can explore our breakdown of the best vulnerability management service provider options.
Key Vulnerability Management Metrics to Track
You do not need thirty metrics. You need the five to eight that map directly to a decision. Here is the core set.
| Metric | What it measures | Why it matters |
| MTTP | Avg days from patch availability to active in production | Shows how fast you close known holes |
| MTTR | Avg days from detection to full fix | Captures the whole response, not just the patching step |
| MTTD | Avg days from a vulnerability becoming detectable to it being found | Exposes gaps in scan frequency and coverage |
| Scan Coverage | % of assets actually scanned | Unscanned assets are unmeasured risk |
| Remediation SLA Compliance | % of vulnerabilities fixed inside their deadline | Turns policy into something you can audit |
MTTP (Mean Time to Patch)
There is no single industry definition of MTTP, so pin yours down before you report it. In this guide, MTTP means the average time between a patch becoming available and that patch being active in production. Other teams start the clock at disclosure, or at detection. Any of those work. Mixing them does not.
Watch the starting point carefully, because measuring from the wrong event flatters the number and hides real exposure. Whichever definition you pick, keep it consistent across every report that anyone is going to compare.
Watch Out: A reported MTTP can look excellent while the systems it describes are still exposed. If your tooling treats package installation as the endpoint, a kernel or shared library fix can sit installed but inactive until the next reboot or service restart. Installed and protected are not always the same moment – and that gap can be invisible on any dashboard that treats installation as the finish line.
This is also where scanner false positives pile up, since a version check on disk says nothing about what is actually loaded.
MTTR (Mean Time to Remediate)
MTTR is broader than MTTP. It covers the full lifecycle from detection to resolution, including triage, prioritization, testing, and deployment. Remediation might mean patching, but it might also mean a configuration change or ripping out the affected component entirely.
Use MTTR for the honest picture of organizational response speed, and MTTP to isolate the patching step itself. If MTTR is high while MTTP is low, the bottleneck sits upstream in triage and approval rather than in deployment.
MTTD (Mean Time to Detect)
MTTD measures the average time between a vulnerability becoming detectable in your environment and your organization identifying it. It is often a coverage problem wearing a speed problem’s clothes. Scan once a week and cadence alone can add up to seven days of delay, averaging around half that across findings, before anyone has done a single thing wrong.
The fix is usually scan frequency and better asset discovery rather than faster patching. You cannot remediate what you have not detected yet.
Scan Coverage
Scan coverage is the percentage of your known assets that get scanned on schedule. It is the metric that catches the shadow server nobody decommissioned and the new node that never got tagged.
Coverage below 100% means the metrics you build from those scan results describe only part of the environment. Scan 80% of your assets and your MTTP describes that 80%. The remaining fifth is a blind spot where exploitable vulnerabilities can sit unnoticed.
Remediation SLA Compliance
SLA compliance is the percentage of vulnerabilities resolved within their assigned deadline. Deadlines vary by organization, but a common shape is critical-severity vulnerabilities within 7 days and high-severity within 30. It converts your patching policy from a document into something auditable.
Non-security stakeholders tend to grasp this one immediately, because it reads like a contract. When it drops, there is a specific and defensible reason to ask for resources. Pay attention when SLA misses cluster around systems that are hard to take offline, since that is often where rebootless patching pays off most.
What Happens When Patching Falls Behind
Slow patching is not just a hygiene problem. It leaves exploitable weaknesses open for longer, and the window you have to close them keeps shrinking. VulnCheck’s first-half 2026 data puts the median time from CVE publication to KEV status at 80 days, down from 120 days in 2025. Known exploitation is not rising in proportion to disclosure volume, since the KEV-to-CVE ratio fell to roughly 1.4% over the same period. The vulnerabilities that do get exploited are simply reaching that status faster.
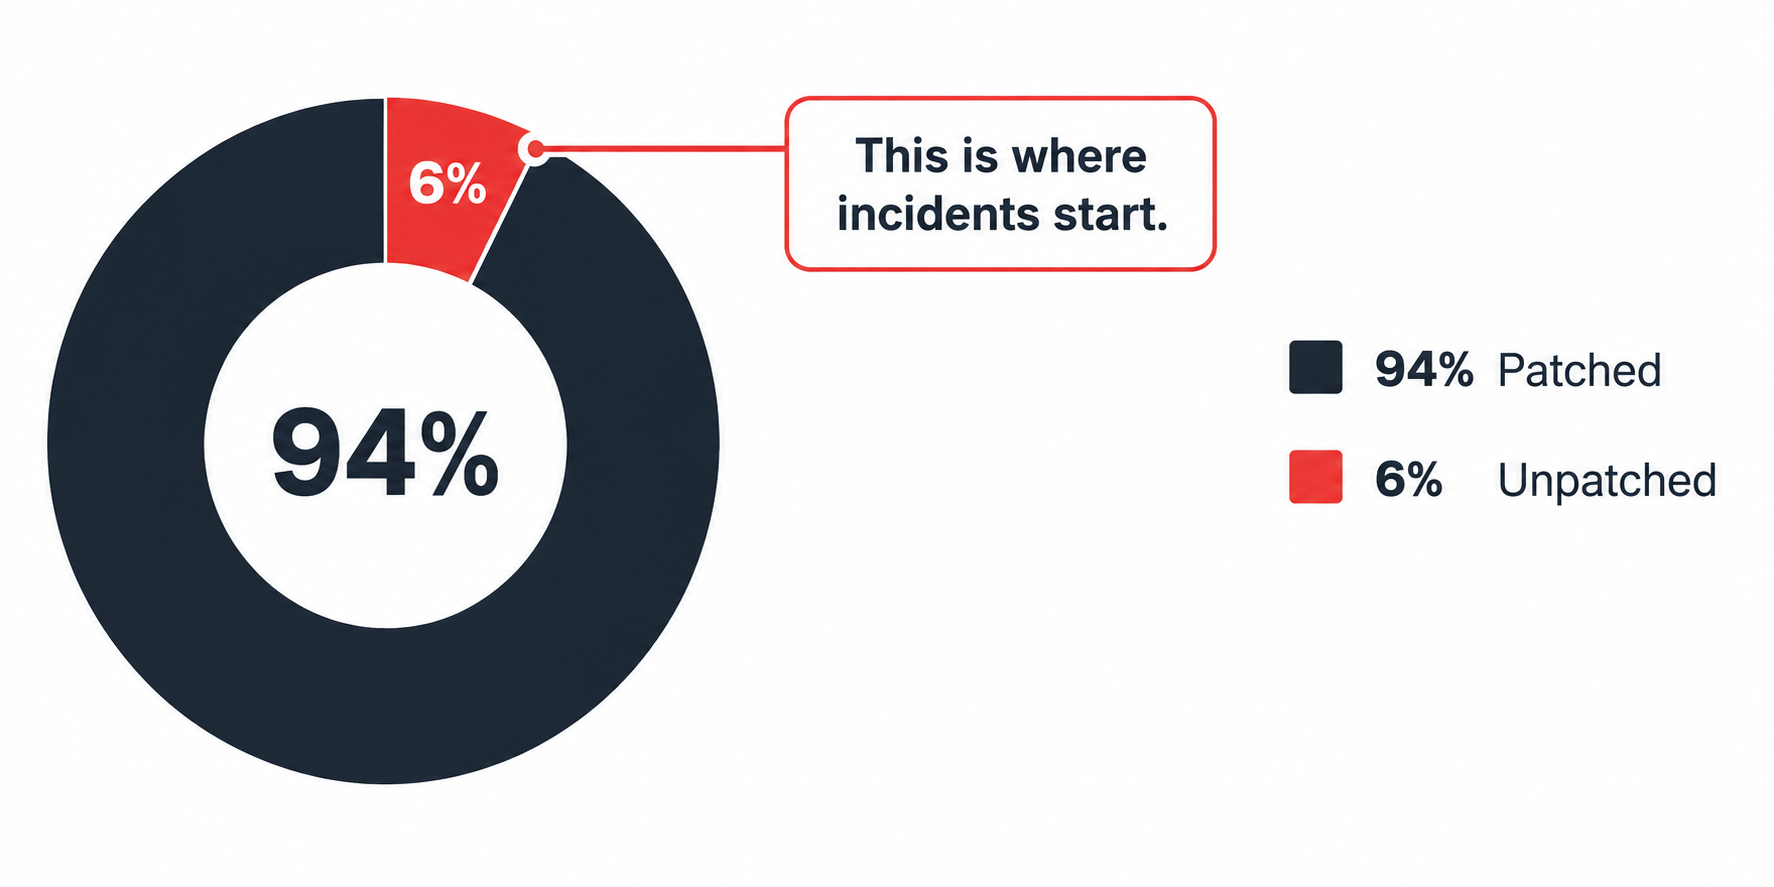
Consider a familiar shape. A program reports 94% SLA compliance while one hard-to-patch asset class, such as a database tier or an appliance fleet that needs a reboot, quietly accumulates most of the remaining 6%. The aggregate dashboard looks healthy. The concentration is what carries the risk, and an average will never show it to you.
When something does go wrong, the consequences are rarely proportionate to the delay. A missed patch on the wrong system can mean a data breach, regulatory fines, or weeks of incident response work that dwarfs whatever effort the patch would have taken.
There is a harder variant of this problem, which is systems past end of life where the vendor patch simply does not exist. If legacy Linux boxes are running unsupported versions, that is the exact gap Endless Lifecycle Support is built to fill, keeping CVE patches flowing after the vendor’s support window closes. TuxCare’s CVE Tracker is a useful starting point, since it maps known CVEs across end-of-life operating systems, runtimes, libraries, and frameworks, lets you filter by severity, product, component, and fix status, and will notify you when a fix status changes.
Live Patching as a Way to Reduce MTTP
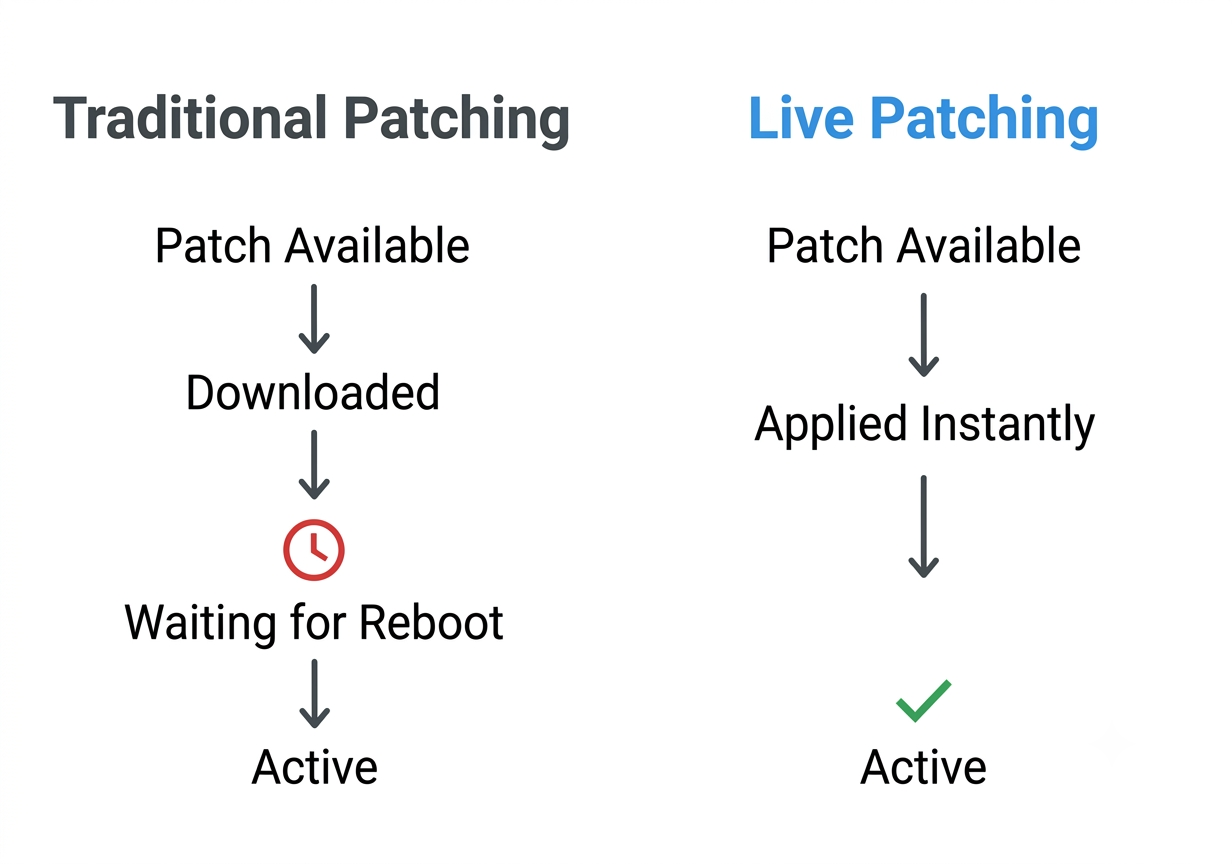
For kernel patching specifically, one of the biggest reasons MTTP balloons is the reboot requirement. Patching a kernel the traditional way means scheduling downtime, getting change approval, and coordinating with every team that owns a workload on that host. So patches wait. Sometimes for weeks.
Live kernel patching breaks that dependency by applying security fixes to a running kernel without a restart. Exposure to a critical kernel CVE can be remediated in hours instead of sitting in a queue until the next maintenance window, and the installed-but-inactive gap that inflates MTTP disappears, because the fix goes live the moment it is applied.
TuxCare’s KernelCare live-patches more than 70 distribution versions out of the box, including RHEL, AlmaLinux, Rocky Linux, Ubuntu, Debian, Oracle Linux, CloudLinux, and Amazon Linux. For teams running 24/7 workloads where reboot scheduling is the real bottleneck, it is one of the highest-impact changes available to MTTP. LibCare extends the same approach to shared libraries like glibc and OpenSSL, which carry their own serious CVE exposure.
How to Interpret Vulnerability Metrics
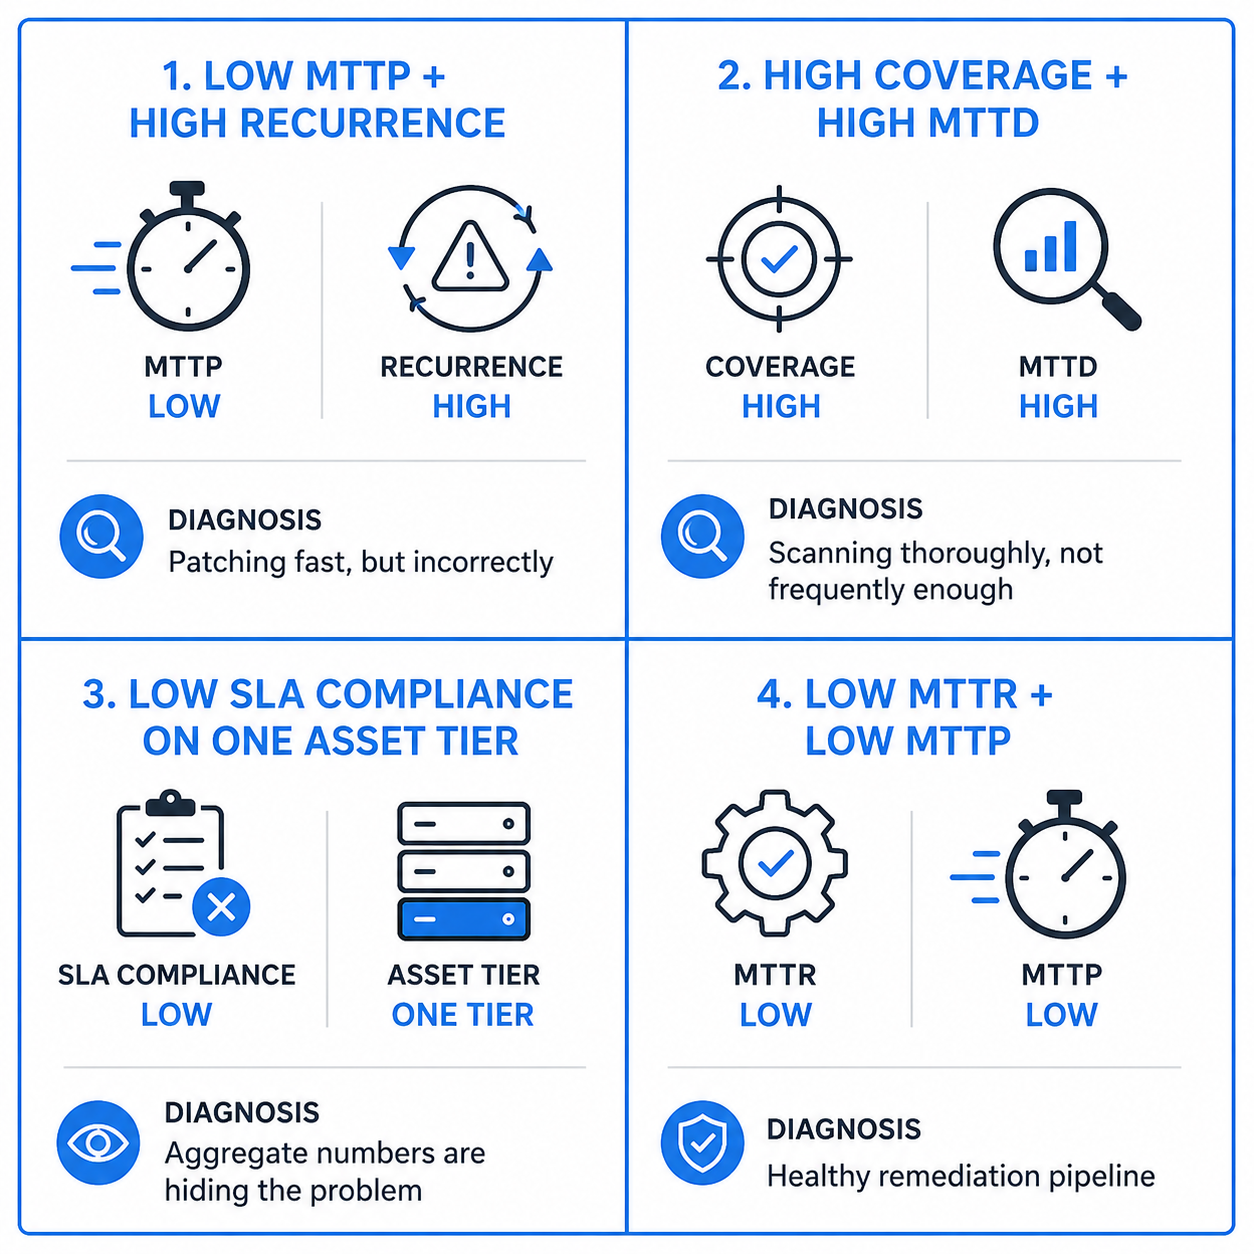
A number on a dashboard is not a finding. It is a prompt. Interpretation is where metrics earn their keep, usually by reading two of them together to spot what either one alone would hide.
Start with relationships rather than absolutes. A low MTTP looks great until you put the recurrence rate next to it. Recurrence rate is the share of remediated vulnerabilities that reappear on the same asset inside a set window, and a high one means fixes are going in fast and not sticking. High scan coverage alongside a high MTTD may point to insufficient scan frequency, or to another delay in the detection pipeline such as late signatures or incomplete asset discovery. A clean aggregate SLA number can mask one asset class that is chronically late, so segment by asset criticality and vulnerability risk before declaring a win.
A few questions turn those numbers into decisions. Is MTTP trending in the right direction, or did one good month flatter the average? Are misses concentrated in a specific asset group, operating system, or team? Does remediation speed actually track exploitation evidence, or just CVSS score? And how much of the open backlog is security debt that has quietly been accepted as permanent?
Context also lives in your software supply chain. Vulnerabilities buried in transitive dependencies are easy to miss unless your tooling understands the full dependency graph, whether it resolves that graph directly or consumes an SBOM. Risk tolerance is contextual too. The acceptable MTTP for an internal wiki is not the acceptable MTTP for a system handling patient records.
Vulnerability Management Optimization Strategies
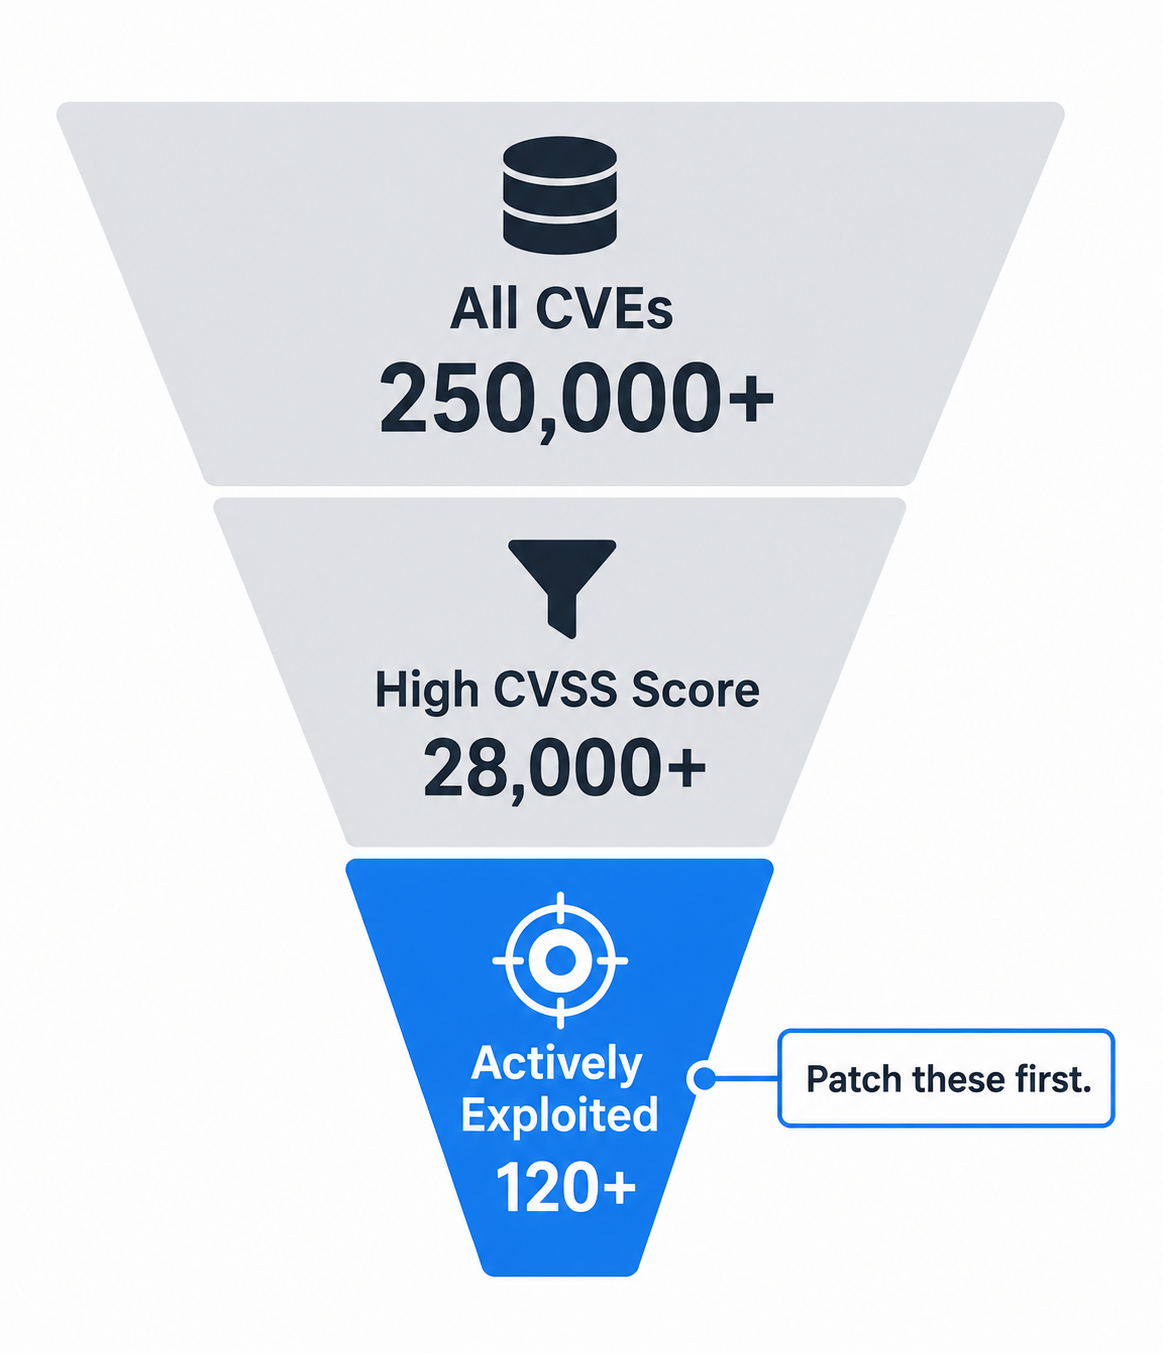
Good metrics show you where you are slow. These strategies are how you get faster without breaking production or burning out the team. Pick the one that maps to your worst metric and start there.
Prioritize by Exploitability, Not Raw Severity
CVSS tells you how bad a vulnerability could be in theory. It does not tell you whether anyone is exploiting it right now. Teams can drown when they treat every critical as equally urgent, which makes it harder to see which vulnerabilities actually demand action tonight.
Cross-reference your scanner output against the CISA Known Exploited Vulnerabilities Catalog, which is built specifically on evidence that a vulnerability has been exploited in the wild. A medium-severity bug with confirmed exploitation is more urgent than a critical bug with nothing behind it. Then pair CVSS with EPSS, the Exploit Prediction Scoring System, a machine-learning model from FIRST that estimates the probability a published CVE will be exploited in the wild in the next 30 days. CVSS describes technical severity, the KEV catalog records what has already been exploited, and EPSS estimates what is likely to be exploited next. Those three answer different questions, and together they beat severity alone when you are deciding what gets patched tonight and what can wait for the next sprint.
Automate the Handoffs, Not Just the Scans
In a lot of workflows, MTTR grows because of dead time between steps. A scan finishes, a ticket sits, an approval waits. If the handoffs are the bottleneck, automating detection alone will not fix it.
Wire scanner output directly into ticketing with severity-based routing and auto-assignment. Auto-create change requests for routine patches so engineers approve rather than transcribe. The goal is removing the gaps where a vulnerability sits in an inbox, because that is where days quietly accumulate. Small process gaps compound into large exposure windows faster than most teams expect.
Tie Every Metric to an SLA and an Asset Tier
A metric with no target is trivia. Assign deadlines by severity and asset criticality, then measure compliance against those deadlines rather than chasing a global average.
Define tiers concretely. Internet-facing and data-handling systems get the tightest SLAs, and internal low-value assets get looser ones. This stops your team from spending equal effort on a public API gateway and a test box nobody reaches, and it makes your reporting honest, because aggregate numbers stop hiding the assets that actually matter.
Best Practices for Reducing MTTP
Reducing MTTP comes down to removing friction between patch exists and patch is live. Eliminating the reboot dependency removes a major source of delay wherever that is possible, which is what live patching for kernels and shared libraries buys you. Pre-approving low-risk patches keeps routine updates out of the change advisory queue entirely. Staging rollouts through a canary group before a broad ring lets you move fast without betting production on an untested patch. Keeping a current asset inventory matters because you cannot patch fast what you did not know you owned. And prioritizing by real-world risk means your fastest response goes to the vulnerabilities that are known to be exploited or highly likely to be.
Decide your default posture deliberately. If you can tolerate short maintenance windows, conventional patching with tight SLAs works fine. If your workloads cannot absorb downtime, live patching is one of the most effective ways to hit aggressive MTTP targets without waiting on a window, alongside options like rolling restarts across a highly available cluster.
Strengthen Vulnerability Management with TuxCare
Metrics show you the problem. Closing the gap between detection and protection is the harder part, and it usually comes down to how fast you can patch without disrupting production.
That is the gap TuxCare’s KernelCare and LibCare close, by shrinking the delay between a security fix becoming available and that fix being active on a running system. Endless Lifecycle Support addresses a different gap, which is what to do once the upstream fix no longer exists at all, by continuing to deliver vulnerability patches after vendor support has ended.
If your worst metric is MTTP on systems you cannot easily reboot, that is exactly the problem TuxCare is built around.
FAQs
MTTR is usually the most useful single number, because it captures the whole response from detection through triage to fix rather than one step of it. Read it alongside detection and coverage, though. A low MTTR does not help much if vulnerabilities are being found late, or if a chunk of the estate never gets scanned at all.
Vulnerability management metrics measure the whole risk lifecycle, which is detection, prioritization, and remediation across patches, config changes, and removals. Patch management metrics are narrower and focus only on getting updates deployed. Patching is one tool inside vulnerability management, not all of it.
Operational metrics like MTTP and scan coverage are commonly reviewed weekly, with monthly or quarterly trend reporting for leadership. Review more often during active incidents or after a major release. The cadence should match how fast the underlying number can actually change.
Five to eight is a practical starting point. That is enough to cover speed, coverage, and risk posture without drowning in dashboards nobody reads. If a metric never changes a decision, cut it. Every number you track should map to an action.